Since May of 2020, corn prices have ranged from $3.20 to $8.20 per bushel. While many factors go into price discovery, stock/usage estimates arguably hold the most weight.
What is stock/usage? The stock to usage ratio tells us how much supply we have at the end of the year with respect to how much we use annually. The equation is Ending Stocks divided by Total Usage. So, if projected ending stocks for corn is 1.5 billion bushels, and total usage for the year is 15.0 billion bushels, the stocks/usage ratio is 1.5/15.0 or 10%.
Stock/Usage = Ending Stocks/Total Usage
Why are stock/usage estimates so important? It tells the market if a specific market’s supply is burdensome, adequate, or tight. When ending stock are burdensome, old crop declines to find additional demand and new crop prices come down to discourage planted acres. When ending stocks are tight, old crop prices rally to ratio demand and new crop prices rally to encourage farmers to plant more acres for the next marketing year. During times of adequate supplies, the market tends to be range bound.
2019-2024 Stock/Usage Example
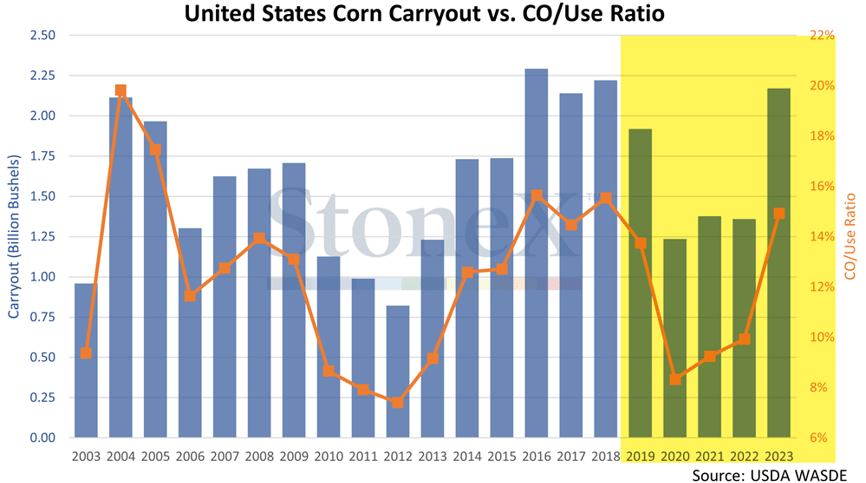
On the chart below we see how stock/usage is adequate to burdensome at 15% in 2019. Supplies get very tight in 2020 with stock/usage under 9% and the tightest since the drought year of 2012. It is not until 2023 until corn stock/usage gets back to a more adequate/burdensome stock/usage of 15%.
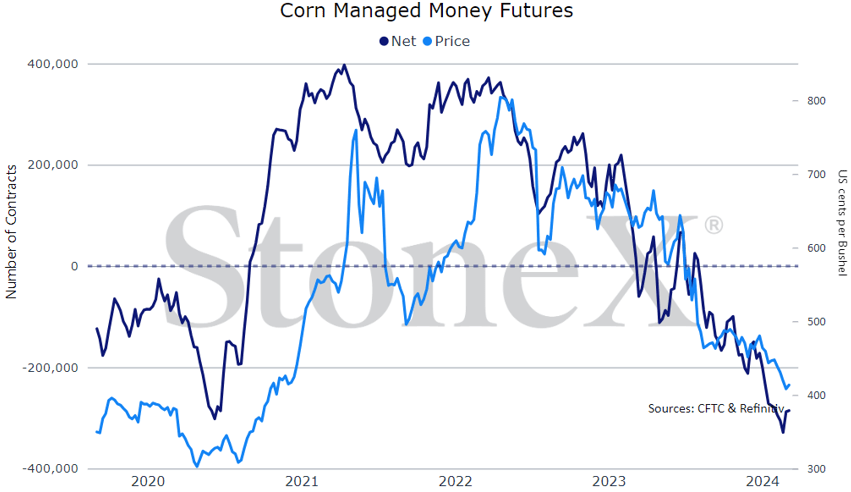
The chart below shows managed money still net short corn at the end of 2019 and heading into 2020. The market did not turn around until China started to heavily buy US corn on the export market. The increased export demand transitioned the US from a burdensomely supplied market in 2019 to a tightly supplied market by the end of 2020. Funds flipped their position from heavily short to heavily long in under a year.
Since 2021 ending stocks have been getting looser. Prices stayed elevated through 2022 while stock/usage was under 10%. Once the stock/usage was over 10% the market came back down and fell into a $4 to $5 trading range.
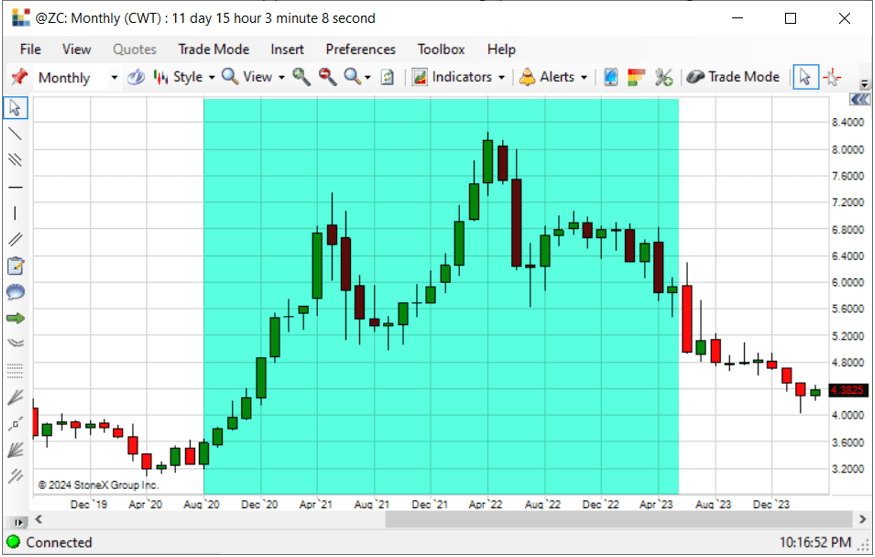
Since 2021 ending stocks have been getting looser. Prices stayed elevated through 2022 while stock/usage was under 10%. Once the stock/usage was over 10% the market came back down and fell into a $4 to $5 trading range. The area in aqua below is when the ending/stocks were projected to be tight. When new crop stock/usage was first estimated in the May 2023 WASDE, ending stocks were no longer projected to be tight and the funds started building their short position.
For more analysis on stock/usage and what you need to do about it with concern to the corn market, sign up for our Marketing Corn in a Low Priced Environment webinar. We will go over our stock/usage estimates for the old crop 2023/24 and new crop 2024/25 marketing years. Farmers will learn what strategies are best for corn in low priced environment. We’ll also show farmers what they need to look for when the market eventually flips from bearish/neutral to bullish.
Click Here to Register for the 'Marketing Corn in a Low Priced Environment' Webinar
This material should be construed as the solicitation of an account, order, and/or services provided by the FCM Division of StoneX Financial Inc. (“SFI”) (NFA ID: 0476094) or StoneX Markets LLC (“SXM”) (NFA ID: 0449652) and represents the opinions and viewpoints of the author. It does not constitute an individualized recommendation or take into account the particular trading objectives, financial situations, or needs of individual customers. Additionally, this material should not be construed as research material. The trading of derivatives such as futures, options, and over-the-counter (OTC) products or “swaps” may not be suitable for all investors. Derivatives trading involves substantial risk of loss, and you should fully understand the risks prior to trading. Past results are not necessarily indicative of future results.
All references to and discussion of OTC products or swaps are made solely on behalf of SXM. All references to futures and options on futures trading are made solely on behalf of SFI. SXM products are intended to be traded only by individuals or firms who qualify under CFTC rules as an ‘Eligible Contract Participant’ (“ECP”) and who have been accepted as customers of SXM.
SFI and SXM are not responsible for any redistribution of this material by third parties, or any trading decisions taken by persons not intended to view this material. Information contained herein was obtained from sources believed to be reliable, but is not guaranteed as to its accuracy. Contact designated personnel from SFI or SXM for specific trading advice to meet your trading preferences.
Reproduction or use in any format without authorization is forbidden. © Copyright 2024. All rights reserved.
See why StoneX is a partner of choice